
Four charts reveal the evolution of U.S. freight diversion patterns
Since the pandemic, shippers have significantly adjusted their logistics networks in pursuit of supply chain reliability, causing cargo to divert from major gateway ports to smaller and mid-sized ports. Four charts illustrate how this trend has reshaped the U.S. port landscape and market share.
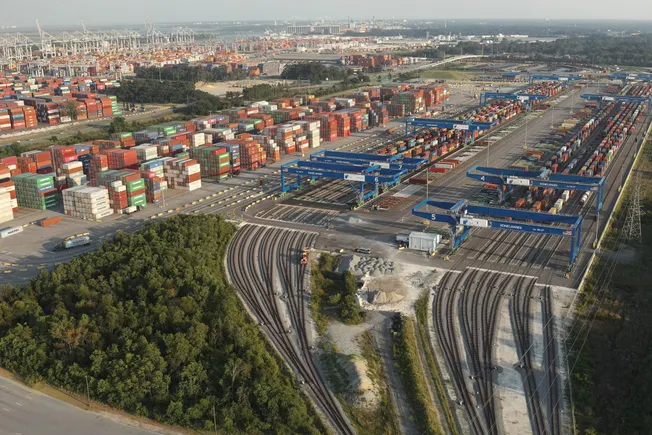
Over the past few years, the enormous efforts made to keep freight flowing have left a deep imprint on U.S. freight flows, port, and real estate data.
Since the COVID-19 pandemic began, shippers have taken major steps to restructure logistics networks in pursuit of supply chain reliability. For years, many companiesdiverted cargoto avoidcongestion at major gateway portsorthe risk of labor disruptions at West Coast ports. Others simply moved facilities closer to customers andrapidly growing population centersto reduce logistics costs.
Dozens of ports across the country benefited from the combination of these trends. But where exactly did the cargo go? Will these trends continue? With these questions in mind, we consulted multiple analysts and reviewed relevant data.
Here is what we learned.
1. A rising tide lifts all boats: All ports saw growth
The import surge during the pandemic led many U.S. ports to record annual throughput.
According to data collected by Supply Chain Dive, by the end of 2021, the total TEUs (20-foot equivalent units) handled by the top ten U.S. container ports increased by 6.8 million compared to 2019. This increase was more than double the growth of 2.8 million TEUs in the previous two years (2017 to 2019).
However, during the pandemic import surge, growth among the top ten ports was uneven, as shown in the chart below.
By the end of 2022, most major ports had achieved significant throughput growth
Georgia is an example of how rapidly growing regions affect port throughput. The state's manufacturing base, low real estate costs, and convenient carrier locations helped itbecome a logistics hub. Griffith Lynch, executive director of the Georgia Ports Authority, told Supply Chain Dive earlier this year: "Our location is in the heart of the Southeast, and we are the closest port to Atlanta, a major metropolitan area. We not only have excellent rail connections throughout the Southeast, but we can also reach deep into the Midwest."
James Breeze, vice president and global head of industrial and logistics research at CBRE, told Supply Chain Dive that many markets in the Southeast U.S. are benefiting from similar trends, with population and economic growth driving import demand.
"You want to be near there," Breeze said. "You want to save as much on transportation costs as possible. Importing all your goods into Los Angeles and trucking them across the country is extremely expensive."
2. Smaller ports see big growth
While throughput increased, the pandemic-driven import surge also brought shippers a major problem: congestion.
The top ten U.S. container ports handle more than 80% of the nation's cargo volume, and widespread delays forced shippers and carriers to seek alternative routes.Shipping companies adjusted schedules, and some cargo ownerschartered vessels. As congestion persisted, many companies also turned to smaller gateways just a truck ride away from major ports.
For example, by early 2022, FedEx Logistics had launched its so-called "congestion bypass service," selling space on empty containers bound for the Port of Hueneme, north of Los Angeles, to shippers looking to avoid delays at San Pedro Bay ports.
The chart below maps the fastest-growing seaports and related real estate markets in 2022, showing that other smaller gateways, such as Port Freeport south of Houston and the Port of Philadelphia on the East Coast, also benefited significantly from cargo diversion.
Ports near existing markets saw the fastest throughput growth
3. Labor contract negotiations impact West Coast throughput
Even after congestion and demand subsided in 2022, cargo diversion did not slow down, as many shippers worried about another risk: theWest Coast dockworker labor contract negotiationsthat began last May and the potential disruptions they could cause.
Earlier this year, dozens of business groups acknowledged this trend in aletterto the president, saying cargo would not return to the West Coast until an agreement was reached. This trend, along with the effects of congestion and overall demand changes, contributed to growth at ports on other coasts.
But how much of this growth came at the expense of West Coast ports?
According to analysis by Descartes, since 2021, more than 1 million TEUs of cargo have been diverted from West Coast ports each year, with most of it going to Gulf Coast ports. The supply chain solutions company also found that specific commodity categories such as electronics, furniture, and machinery accounted for a large share of diverted cargo.
"We do believe (Gulf Coast ports) are the biggest winners," said Chris Jones, executive vice president of industry and services at Descartes. "They are not used to handling such large volumes."
Gulf Coast ports saw the most growth from cargo diversion
4. Cargo shifts reshape port market share
The convergence of trends over the past three years has significantly affected cargo flows, reshaping the market share of major U.S. ports.
Some ports rose rapidly in rankings, including the Port of Houston and South Carolina ports, which gained importance due to increased throughput. The same was true for the Port of New York and New Jersey, which became the second-largest container port in the U.S. in 2022, adding 2 million TEUs in throughput since 2019.
In contrast, West Coast ports mostly lost market share.
The ports of Seattle and Tacoma, represented by the Northwest Seaport Alliance, and the Port of Oakland were among the few ports with lower throughput in 2022 than in 2019. Meanwhile, the Port of Los Angeles and the Port of Long Beach saw throughput growth, but growth at other ports eroded their combined market share.
During the pandemic, throughput changes caused some ports to rise rapidly in rankings

Will cargo flow back?
Since the Port of Los Angeles and the Port of Long Beach are among the largest ports in the U.S., several analysts predict that the San Pedro Bay ports may gradually recover some of the lost throughput.
"Changing trade routes is not easy," said Jones of Descartes. Shippers' ability to divert depends not only on the chosen port but also on schedules and inland transportation, such as intermodal capabilities. Moreover, because many shippers' supply chains are built from west to east, he said there is inertia in "flipping the switch."
"There will certainly be some percentage that comes back," Jones said. "What we're watching is what that actual percentage is, and it won't happen overnight."
Similarly, Breeze of CBRE said the Port of Los Angeles and the Port of Long Beach will continue to play critical roles in U.S. supply chains.
According to data collected by Supply Chain Dive, despite lower throughput in 2022, the two ports together handled 35% of total imports at the top twelve U.S. ports. Breeze noted that these two ports remain the closest and fastest gateway for Asian goods entering rapidly growing markets such as the U.S. Southwest.
"We're not seeing tenants leave Los Angeles and then move into Savannah," Breeze said. "What they need now is to keep space in Los Angeles while adding a second space in Savannah. That's part of what we call supply chain resilience."
Matthew Burgess, vice president of global ocean services at C.H. Robinson, said that once the risk of disruptions related to West Coast port contracts subsides, shippers of high-value or time-sensitive goods are most likely to return cargo volumes to Los Angeles and Long Beach.
But he also predicted that some diversion may be permanent, especially for shippers focused on cost or whose goods are not time-sensitive.
"Overall, especially if cargo is headed east of the Mississippi, it's still cheaper," Burgess said.